The Digital State of Web Development in 2023 Part Two
Table of Contents
Introduction
This is a short continuation of the previous article combining the reports mentioned to bring practical methodologies from the findings developers can implement. You can checkout the previous using the links below.
Ecommerce
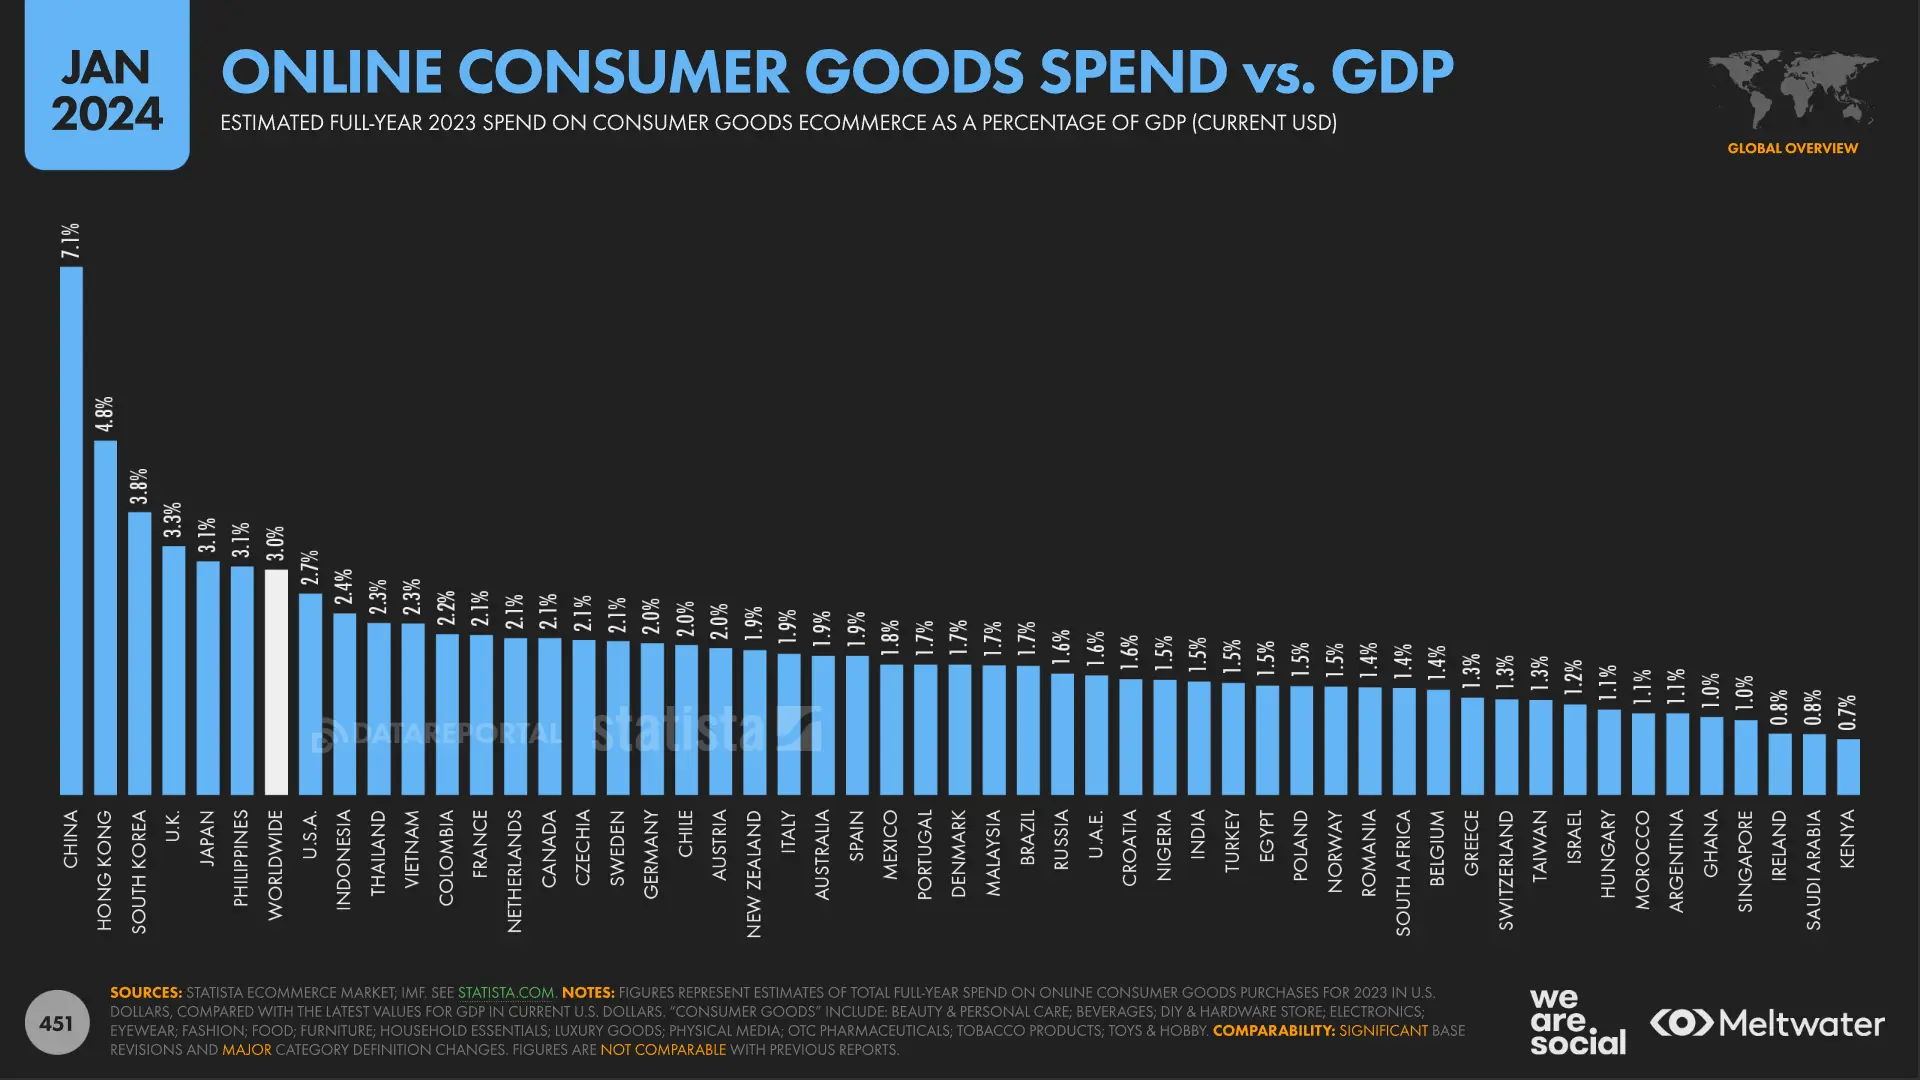
Above, the data compares how much each country spends on buying goods online relative to the size of their economy. China, has the highest percentage at 7.1%, meaning a large portion of its GDP is spent on online shopping. Others include Hong Kong (4.8%), South Korea (3.8%), Japan (3.1%), and the Philippines (3.1%). These indicate significant e-commerce markets with robust online shopping cultures and high potential for e-commerce businesses.
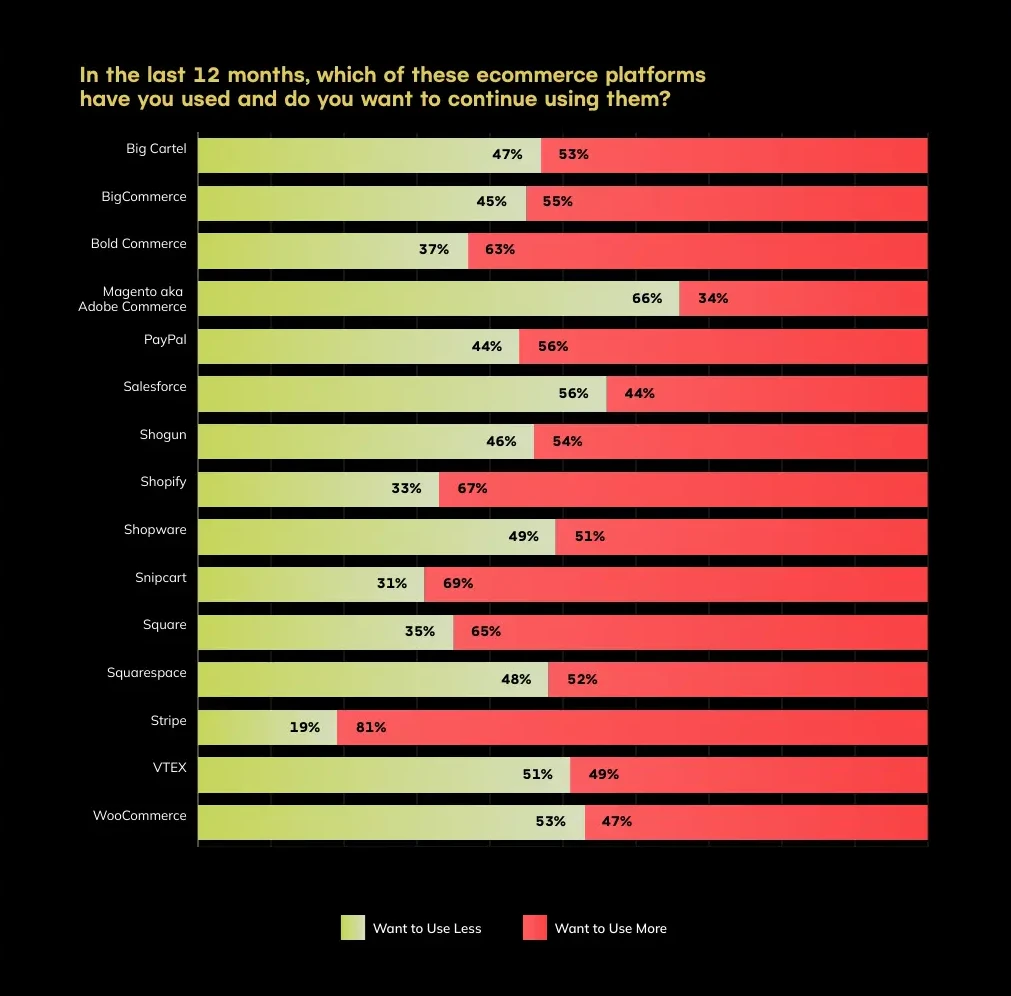
Netlify’s state of the web graphs the opinions of developers to reflect how easily they believe these markets can be served with the e-commerce platforms they are building products on. We see higher developer retention and satisfaction, and which ones have lower retention and satisfaction comparitively.
Developers can prioritize these regions for tailored e-commerce solutions, localized content, and optimized user experiences to tap into their strong online consumer spending.
Practical
These insights mean developers should focus on mobile optimizations, localization, and using platforms that have a relative higher retention.
Conclusion
I recommend to skim through the reports posted in the links below. Hope you enjoyed the two part article. Until then, have a good one!